Annual Report for The University of Waikato
The Annual Report provides detailed information on the University's financial status and summarises the activities and achievements of the University.
2025 Annual Report
The Annual Report provides detailed information on the University's financial status and summarises the activities and achievements of the University of Waikato.
From the Chancellor
Tēnā koutou katoa
The year 2025 has been a very special one for our University, in so many ways. Last year we celebrated 60 years since the University of Waikato began, and we took the opportunity to reflect upon the journey we have shared since we began in 1964. In 2025, as we begin our seventh decade, we have been fortunate to be able to build upon the very strong foundation that our first 60 years have provided.
The strength of our world is reflected in the motto adopted by the University in the mid-1990s – “Ko Te Tangata”. In our 61st year it remains key to our success. As I write my first report as Chancellor, I acknowledge the contributions of those who have served before me, whose care and commitment to the University have made a genuine difference.
In June we farewelled Sir Anand Satyanand, Chancellor for six years. Sir Anand made a significant contribution, leading the University through years that have seen the building of The Pā, the physical and symbolic heart of our campus, and, in July 2025, the announcement, by the Government, of the New Zealand Graduate School of Medicine. He has been a gracious, dedicated, intelligent and committed leader, and I thank him for all that he has done. In October 2025 Sir Anand received an Honorary Doctorate at our Graduation ceremony, a fitting recognition of his contribution.
There have been many wonderful Chancellors over the past 60 years, and we are grateful for their service. Sadly, in 2025 three of our previous Chancellors died. John Jackman (Chancellor in 2006) who passed away in January 2025, Gerald Bailey (Chancellor from 1992 to 1997) who passed away in June 2025, and the Rt Hon Jim Bolger (Chancellor from 2007 to 2019) who passed away in October 2025. I was fortunate to serve on Council with Jim, and his passion for our shared vision was always very clear. He was an able, articulate and very supportive leader who will be missed by all of New Zealand.
I had the privilege of being appointed as Chancellor from July, and have been joined by new Council members The Honorable Te Ururoa Flavell, our new Pro-Chancellor, and new Council members Ms Fiona Michel and Ms Erin Wansbrough. We are fortunate to have the opportunity to learn from their knowledge and experience.
Finishing their terms on Council in 2025 were three very dedicated Council members, Mr Simon Graafhuis, Mrs Meleane Burgess, and our student representative Mr Temepara Smith. Each will be missed, as all made a significant and lasting contribution to the effective governance of the University.
We are indeed fortunate to have the depth of knowledge and experience that we share on Council. It combines with the professional, and at the same time caring, approach shown by all members.
Council approved the new University Strategy document this year, as we continue our focus on ensuring that the people in our care, both staff and students, both current and future, are provided with the best opportunities in an optimum environment, both physical and in wellbeing. Kia Haere Whakamua provides strategic direction for 2025-2029, recognising the importance of the whakataukī “Kia haere whakamua, me hoki whakamuri”. We walk towards our future, recognising the importance of our shared past.
The New Zealand Graduate School of Medicine became a reality this year, with the Government announcement in July 2025. After many years of planning, and a comprehensive assurance process being undertaken by Government, achieving approval has meant that we can proceed with a development that is of genuine significance to New Zealand and our health sector, as well as to our University. The groundbreaking ceremony in December provided the symbolism of beginning this exciting time of planning and preparation for the opening at the start of 2028.
Another significant development in 2025 was the signing of the kawenata between the University and Waikato-Tainui. This kawenata, signed at a formal ceremony in the University wharenui, on the University’s annual Kīngitanga Day, demonstrates a genuine commitment to unity and strong outcomes for all, and reflects the importance of working together to make a difference.
I take this opportunity to express my gratitude, and the gratitude of the University Council, to all who make this University so special, in so many ways. The Senior Leadership Team has worked tirelessly to ensure a successful year, and we recognise their passion for their area of expertise, as well as their care for the whole organisation.
They have been ably led by Vice-Chancellor Neil Quigley, who has provided extraordinary tenacity and absolute dedication to ensure that the New Zealand Graduate School of Medicine journey has finally begun. His contribution to the success of 2025 is significant, and we are grateful to him for his complete dedication to our vision.
Together, the VC and the Leadership Team drive our success; but their achievements are made possible only by a wonderful staff, whose hard work, enthusiasm for learning, and commitment to the values we share, bring our vision into reality. I offer my sincere thanks to all.
Ngā mihi, tēnā koutou katoa.
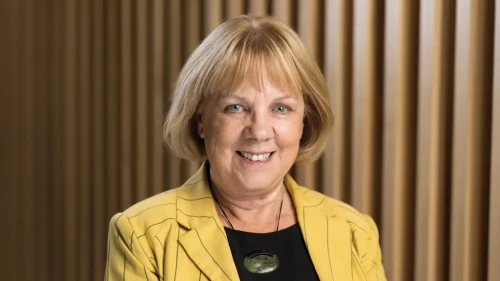
Mrs Susan Hassall ONZM
Chancellor
Vice-Chancellor's Overview
E ngā mātāwaka o te motu, e rau rangatira mā, tēnā koutou katoa.
Rarau mai ki Te Whare Wānanga o Waikato, ki te ahurewa o tūmanako, o wawata, o moemoeā.
Piki mai, kake mai, whakatau mai a te ngākau ki a koutou katoa. In 2025 the University of Waikato celebrated a number of milestone achievements and embarked on a new University Strategy to deliver against our future ambitions.
The momentum we have seen in recent years with enrolments continued, and this year we welcomed our largest ever international and school-leaver cohorts. Across the board the University’s enrolments have grown 14.7% to 13,095 EFTS, which surpasses pre-pandemic levels. It has also enabled the University to record its largest ever financial surplus of $19 million (Group result of $22 million).
These results show the benefit of a collective effort in student recruitment in recent years – from individual school level engagements through to the combined strategies of our central services, and our academic units championing new programme offerings, which has enabled this growth both domestically and internationally.
This year’s strong growth and financial performance provide us with a platform to continue to invest in delivering an outstanding student experience, in expanding and modernising our campuses, and initiatives that will further aid our growth. Alongside this, the University launched its new vision and strategy – Kia Haere Whakamua – meaning to 'collectively move forward'. The Strategy brings to life our motto, Ko Te Tangata, meaning ‘For the People,’ across nine strategic priorities.
In launching the new Strategy, and through consultation processes to support a new Research Plan and an Academic Plan, the executive leadership team and I have enjoyed engaging with staff, who are energised by our positive trajectory and what our future looks like.
A number of new initiatives also began this year that will support the University on its growth trajectory.
Building on the positive results achieved through the global student feedback survey Etio, detailed on page 33, the University began a programme of work to refine and strengthen support for all learners across the University. Alongside strong growth in enrolments, it was timely that we reviewed how we scale and invest in support services for the future growth we anticipate. The revised Student Support Programme continues to take a student-centred approach, and seeks to produce a connected support infrastructure for students that is responsive, efficient and equitable.
It was a significant year for the Division of Health, which became its own academic unit at the start of the year to reflect the scale and demand for new programmes including nursing, pharmacy and midwifery. Following a thorough Cost Benefit Analysis and Detailed Business Case process, in July we received Government approval for our proposal to open a new graduate-entry medical school, a landmark moment for New Zealand, detailed further on page 12. All of the hard work of the Division in recent years to respond to health workforce needs and in undertaking critical health research has laid the foundations for the New Zealand Graduate School of Medicine to open its doors in 2028.
Campus development highlights this year included the construction of a new 75-bed self-catered apartment building on Knighton Road and significant work to refurbish and modernise space in J Block for the staff within the School of Psychological and Social Sciences. In particular, the work in J Block will become a future roadmap for the way we design and partner with academic areas to refresh office spaces.
In Tauranga, future expansion plans for the campus were cemented with the purchase of the Bongard Centre building in December from the Government. The building sits on a prime site on Cameron Road and is part of a wider strategy for the University to secure key buildings on the blocks surrounding the campus to aid future growth. Coordinated efforts to raise the profile of the Tauranga campus continue and were supported this year with the development of a new marketing creative showcasing the lifestyle benefits for prospective students.
Two years on from opening The Pā, the University is seeing growing demand to host external events and conferences. This provides a revenue source for the University as well as opportunities for engagement with a wide range of valued community groups. Significant events in 2025 included the Management School’s fifth and largest NZ Economics Forum, which included a guest appearance from former Australian Prime Minister Scott Morrison, an Advanced Energy Symposium attended by the Minister for Universities, the National Rural Health Conference and a global conference hosted by the MBIE-funded research group, Working to End Racial Oppression, led by the University of Waikato.
Efforts to grow our international brand included the University being invited to join the Prime Minister’s trade mission to India in May and signing of MOU agreements with Indian universities, and, in late 2025, the approval of a proposal for a joint institute with Shandong University – one of China’s oldest and most prestigious universities.
In response to major changes announced by the Government to New Zealand’s research funding landscape this year, the University developed a range of initiatives aimed at strengthening research capability, visibility and enabling researchers to continue developing high-quality ideas and collaborations during this period of uncertainty. Research revenue remained similar to previous years at $51 million.
The University has an ongoing focus on developing a strong health and safety culture, and progress this year included nearing completion of the actions under the Enforceable Undertaking entered into with Worksafe in 2024. With ‘driving for work’ identified on our critical risk framework, this year we have also taken steps to review and improve the way we administer and oversee the use of the University’s fleet vehicles.
We marked the end of Sir Anand Satyanand’s term as Chancellor and the appointment of long-serving Council member Mrs Susan Hassall in July as our new Chancellor. A highly respected education leader, Mrs Hassall held the role of Pro-Chancellor for eight years and has been a member of the University Council for the past nine. The University is fortunate to have such a strong continuity of leadership in our new Chancellor and I acknowledge the advocacy and support both Sir Anand and Mrs Hassall have offered over many years for the medical school proposal, throughout successive governments and often at times, a turbulent political environment.
Sir Anand’s leadership through significant events including the construction and opening of The Pā and through the pandemic was acknowledged by the wider University community with the award of an Honorary Doctorate in October. At the same time, the University also awarded linguist and translator Te Haumihiata Mason ONZM with an Honorary Doctorate for her outstanding work in, and commitment to, the revitalisation of te reo Māori.
In September we acknowledged the passing of Emeritus Professor Dame Peggy Koopman-Boyden. Dame Peggy was a former Dean of the Faculty of Arts and Social Sciences and Deputy Vice-Chancellor Academic at Waikato, who made significant contributions to the University and the country as a social gerontologist.
Our senior leadership team welcomed two new Pro Vice-Chancellors; professional director and distinguished alumna of the University of Waikato, Jennifer Kerr, to lead the Waikato Management School and geographer and climate expert, Professor Tim Smith, to lead the Division of Arts, Law, Psychology and Social Sciences.
Reflecting on a momentous year it has been for the University of Waikato and our community, it brings me a great sense of pride to see the impact we continue to make, and the opportunity for Waikato to evolve further on the national and global stage. The level of success we have seen this year would not have been possible without the support of the University Council, our senior leadership team, and all our staff, who work hard every day to deliver for our students and our future.
Ngā mihi nui,
Professor Neil Quigley
Vice-Chancellor
2025 at a glance
- Ministry-funded equivalent full time students (EFTs):
- 2,360 (up 5.8%) Māori students
- 896 (up 14.7%) Pacific students
- 9,358 (up 8%) domestic students
- 3,707 Ministry-funded EFTs generated by international students:
- 2,745 onshore international students
- 962 offshore international students
- QS World University Ranking 281
- 6,300 Work-Integrated Learning experiences taken, up 17% on 2024
- Net Promoter Score (NPS) of 23, up 8 points on 2023
- 17.4% Earnings before interest, taxation, depreciation and amortisation as a proportion of revenue, up from 15.4% in 2024
Latest Annual Report
Past Annual Reports
-
2024 Annual Report (5 MB)
-
2023 Annual Report (4.1 MB)
-
2022 Annual Report (8.3 MB)
-
2021 Annual Report (5.2 MB)
-
2020 Annual Report (1.9 MB)
-
2019 Annual Report (3.9 MB)
-
2018 Annual Report (5 MB)
-
2017 Annual Report (3.9 MB)
-
2016 Annual Report (3.5 MB)
-
2015 Annual Report (4 MB)
-
2014 Annual Report (6.7 MB)
-
2013 Annual Report (6 MB)
-
2012 Annual Report (4.6 MB)
-
2011 Annual Report (2.3 MB)
-
2010 Annual Report (1.3 MB)
-
2009 Annual Report (1 MB)
-
2008 Annual Report (604 KB)
-
2007 Annual Report (876 KB)
-
2006 Annual Report (1 MB)
-
2005 Annual Report (1.5 MB)
-
2004 Annual Report (1.5 MB)
-
2003 Annual Report (1.3 MB)