Annual Report for The University of Waikato
The Annual Report provides detailed information on the University's financial status and summarises the activities and achievements of the University.

2023 Annual Report
The Annual Report provides detailed information on the University's financial status and summarises the activities and achievements of the University of Waikato.
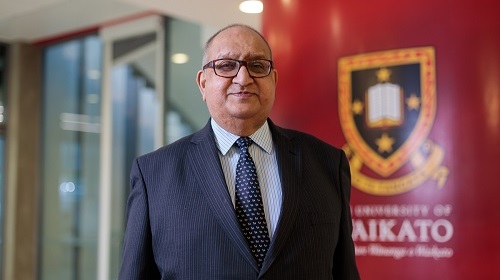
From the Chancellor
 E tēnā koutou katoa
This year has been marked by several significant milestones for the University spanning capital investment and new members around our Council table, and while economic challenges persist, I am pleased to say we remain resilient.
This year we celebrated the opening of The Pā, an achievement reflecting nearly a decade of planning for the University's future. The new complex at the entrance of our Hamilton campus has already become a central hub for students and staff, imbuing our campus with a renewed spirit.
The opening ceremony, led by Māori King Tūheitia Pootatau Te Wherowhero Paki, marked a transformative moment for the University and reinforced our special and unique relationship with the Kīngitanga that is integral to our identity.
There were a number of changes around the University Council table this year. We welcomed Kīngi Tūheitia’s daughter, Nga wai hono i te po Paki, to our Council, succeeding the Kīngitanga’s previous representative, Paki Rawiri, who we thank for his important contributions.
Ms Paki is an alumna of the University and holds a Bachelor of Arts and Master of Arts in tikanga Māori and te reo Māori. She has a long association with the University and oversaw the weaving team that prepared the tukutuku panels that reside in the University’s wharenui, Ko Te Tangata, in The Pā.
Our new staff representative, University Librarian Michelle Blake, also joined Council this year, filling the role previously held by Professor Eva Collins. Michelle brings to Council a depth of experience and a new perspective on governance, which will be invaluable. We wish Professor Collins the very best for the future and will miss her measured and sensible advocacy for staff and students alike.
We also bid farewell in 2023 to the University Council’s student representative student Lushomo Thebe. Lushomo graduated as a lawyer and is advancing her career in Auckland, leaving large shoes to fill as her participation and advocacy for students at the Council table was exemplary.
As in the words of Heraclitus, “there is nothing permanent except change” – 2023 also saw us bid farewell to Deputy Vice-Chancellors Robyn Longhurst and Bryony James, who leave behind significant legacies on Council. Both have taken up roles at Victoria University of Wellington and I would like to wish them both well in their career advancement and thank them for the significant contributions they have made to the University and around the Council table.
In my report last year, I made mention of Te Aurei, the post-Taskforce work stream under the leadership of Deputy Vice-Chancellor Māori Dr Sarah-Jane Tiakiwai and Senior Deputy Vice-Chancellor Professor Alister Jones. They have continued to report to Council regularly on progress, and it is hoped the legacy of their work will be that the elimination of casual and systemic racism and discrimination at the University becomes business as usual.
As we look ahead, the University is well positioned heading into 2024 and a major item on the calendar will be our celebration of 60 years of the University.
As our number of graduates over the past 60 years approaches 100,000, it is appropriate we celebrate where we have come from and the foundation that provides us for moving forward.
While the University has faced financial constraints in 2023 and we continue to operate in an evolving and challenging economic environment, our increased domestic enrolment and the return of international students signal positive trends.
As we reflect on the past year, let us heed the wisdom of the Māori proverb “ka mua ka muri”– walking backward into the future, drawing from our collective learning.
Ngā mihi nui,
Rt Hon Sir Anand Satyanand GNZM QSO
Chancellor
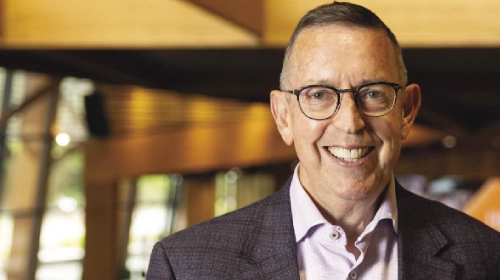
Vice-Chancellor's Overview
E ngā mātāwaka o te motu, e rau rangatira mā, tēnā koutou katoa.
Rarau mai ki Te Whare Wānanga o Waikato, ki te ahurewa o tūmanako, o wawata, o moemoeā.
Pike mai, kake mai, whakatau mai ā te ngākau ki a koutou katoa.
Re-engaging with our international community in 2023 saw us focus on our key international markets including India, China, Vietnam, Malaysia, Indonesia and the Middle East. We also continued expanding our reach into emerging markets including South Korea, Philippines and Sri Lanka, recognising that diversifying our offering both in terms of global reach and the academic opportunities we offer our students is crucial for our long-term sustainability.
Closer to home, the completion of The Pā was a significant milestone for the University, cementing a long-held vision for an integrated and accessible campus facility that promotes social interaction and understanding of our cultural heritage. Post-pandemic, people and communities have a desire to come together again and The Pā is a key space for our students, staff and wider community to gather, learn, share and celebrate. It was a significant moment when our first cohort of students graduated in The Pā in October, fulfilling that vision.
As we respond to the changing needs of our communities and continue to contribute to the educational, social, cultural, and environmental development of our region and New Zealand, the case for New Zealand’s first graduate entry medical school at the University gained traction in 2023. The University is now working with the Ministry of Health on the next steps in establishing the medical school, including a business case.
Significant staff appointments made in 2023 provided leadership in areas that are key to our strategic direction. Professor Tangiwai Rewi was appointed as the new Dean of Te Pua Wānanga ki te Ao, Faculty of Māori and Indigenous Studies, Professor Jo Lane took up the role of Dean of the School of Health and Rose Macfarlane joined the University’s senior leadership team as Director of People and Capability. In addition, in a landmark moment for New Zealand as a Pacific nation and for the University, New Zealand’s first female Pacific Professor in Law, former Justice of the Supreme Court of Samoa, Tologata Tafaoimalo Leilani Tuala-Warren was appointed to the University.
Several strategic projects and investments launched in 2023 will also support the University’s efficiency, innovation and sustainability moving forward. These included the implementation of the Oracle Cloud System, He Whatu Pūmanawa, bringing the University’s human resources and finance processes online, making them more efficient and streamlined for staff. We also launched our staff intranet, Te Hononga, improving internal communication and providing an opportunity for greater connection and collaboration among staff. Alongside this we also opened new facilities for our students, including the new Large-Scale Engineering laboratory.
Our programme of seismic strengthening upgrades across our campus continued and we have also made considerable progress in our carbon reduction programme, including completing the rollout of new energy-efficient LED lighting across the Hamilton campus, installation of solar arrays across a number of buildings, and transitioning of the majority of our vehicle fleet to electric vehicles.
Our research, teaching and connections to industry and business that both benefit our students and foster our industry-relevant, collaborative, and cross-disciplinary research continues to be an area of considerable pride for the University and one where we continue to make solid progress.
The University ranked in the top 250 universities in the world in the QS World University Rankings, released in 2023, the largest increase of any university in New Zealand. We also placed at number one in New Zealand for research, based on the citations per faculty member, the second year in a row the University has achieved this position. We also ranked in the top 100 Universities worldwide in the 2024 QS Sustainability rankings and the Times Higher Education rankings, affirming the real impact our work is delivering in the world. These results were further reinforced by our best Marsden Fund result ever with 11 of our 16 second-round proposals being funded, the fruition of initiatives to improve our performance in external research funding.
Alongside our research successes, we took pride in achieving one of our strongest results in the Academic Quality Agency Cycle 6 Audit. We received 19 commendations supporting the work we are doing to deliver high-quality teaching and learning to a diverse student body and support our staff’s professional development.
The quality of the University’s teaching was also recognised when Dr Ēnoka Murphy was named the Prime Minister’s Educator of the Year at the 2023 Te Whatu Kairangi – Aotearoa Tertiary Educator Awards.
The year 2023 may have again presented many challenges for the University but the hard work and commitment of our staff has again ensured we are well positioned heading into 2024. My thanks to my colleagues on the University Council, to the University leadership team, and to all staff members across our organisation for supporting the success of the University and our students.
Professor Neil Quigley
Vice-Chancellor
2023 at a glance
- Ministry-funded equivalent full time students (EFTs):
- 2,141 (25%) Māori students
- 747 (8.8%) Pacific students
- 8,475 domestic students
- 2,048 Ministry-funded EFTs generated by international students:
- 1,312 onshore international students
- 736 offshore international students
- Times Higher Education (THE) Impact Ranking of 92, down 9 places from 2022
- 3,554 Work-integrated Learning experiences taken, up 5% on 2022
- 3,643 Qualifications completed, up 9% on 2022
- Reduction in tCO2-e (tonnes of carbon dioxide equivalent) down 39.4% against our 2019 baseline
- 745 Active Research Contracts, up 1.7% on 2022
- 36% Proportion of Professors identify as female, 11% increase since 2019
Latest Annual Report
Past Annual Reports
-
2022 Annual Report (8.3 MB)
-
2021 Annual Report (5.2 MB)
-
2020 Annual Report (1.9 MB)
-
2019 Annual Report (3.9 MB)
-
2018 Annual Report (5 MB)
-
2017 Annual Report (3.9 MB)
-
2016 Annual Report (3.5 MB)
-
2015 Annual Report (4 MB)
-
2014 Annual Report (6.7 MB)
-
2013 Annual Report (6 MB)
-
2012 Annual Report (4.6 MB)
-
2011 Annual Report (2.3 MB)
-
2010 Annual Report (1.3 MB)
-
2009 Annual Report (1 MB)
-
2008 Annual Report (604 KB)
-
2007 Annual Report (876 KB)
-
2006 Annual Report (1 MB)
-
2005 Annual Report (1.5 MB)
-
2004 Annual Report (1.5 MB)
-
2003 Annual Report (1.3 MB)